

为客户、合作伙伴或团队成员构建数据看板,已成为软件开发者、数据科学家、机器学习工程师以及数据工程师必备的关键技能之一。即使主要从事后端数据处理,所处理的数据通常也需要在某个阶段以直观的方式呈现给用户。幸运的话,组织内可能设有专门的前端团队来处理这些工作;然而,更多时候,这项任务会落在工程师自身肩上。
如今,单纯作为一名不具备HTML、JavaScript等前端经验的Python开发者已不再是借口,因为过去几年中涌现了许多强大的Python库,例如Streamlit和Gradio,它们极大地简化了前端界面的开发。
然而,本文并非探讨这些Python库。相反,它将深入探索如何通过学习新技能,利用前端开发领域经久不衰的基石技术——HTML、JavaScript和CSS——来构建一个数据看板,特别适合那些希望拓展技能边界的Python开发者。
本数据看板的数据将来源于一个本地的SQLite数据库。为演示目的,文中创建了一个名为“sales_data”的SQLite表,其中包含了模拟的销售数据。以下是该数据的表格形式展示。
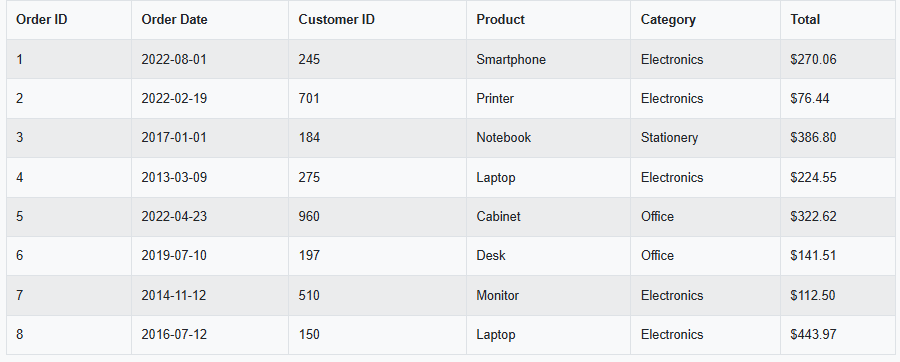
下方提供了一段代码,读者可以依此自行创建SQLite数据库及表,并填充所示的示例数据,以便跟随教程进行实践。
文中仅向数据库插入少量记录,这并非代码无法处理大规模数据量。其主要目的是为了将注意力集中于数据看板的功能实现上,避免被复杂的数据处理所分散。读者可以根据下方提供的脚本,根据需要自行向输入数据集添加更多记录。
因此,在进入前端开发之前,首先将继续在Python环境中,通过编程方式设置SQLite数据库。
import sqlite3

# Define the database name
DATABASE_NAME = "C:Users	homaprojectsmy-dashboardsales_data.db"

# Connect to SQLite database
conn = sqlite3.connect(DATABASE_NAME)

# Create a cursor object
cursor = conn.cursor()

# SQL to create the 'sales' table
create_table_query = '''
CREATE TABLE IF NOT EXISTS sales (
    order_id INTEGER PRIMARY KEY,
    order_date TEXT,
    customer_id INTEGER,
    customer_name TEXT,
    product_id INTEGER,
    product_names TEXT,
    categories TEXT,
    quantity INTEGER,
    price REAL,
    total REAL
);
'''

# Execute the query to create the table
cursor.execute(create_table_query)

# Sample data to insert into the 'sales' table
sample_data = [
    (1, "2022-08-01", 245, "Customer_884", 201, "Smartphone", "Electronics", 3, 90.02, 270.06),
    (2, "2022-02-19", 701, "Customer_1672", 205, "Printer", "Electronics", 6, 12.74, 76.44),
    (3, "2017-01-01", 184, "Customer_21720", 208, "Notebook", "Stationery", 8, 48.35, 386.80),
    (4, "2013-03-09", 275, "Customer_23770", 200, "Laptop", "Electronics", 3, 74.85, 224.55),
    (5, "2022-04-23", 960, "Customer_23790", 210, "Cabinet", "Office", 6, 53.77, 322.62),
    (6, "2019-07-10", 197, "Customer_25587", 202, "Desk", "Office", 3, 47.17, 141.51),
    (7, "2014-11-12", 510, "Customer_6912", 204, "Monitor", "Electronics", 5, 22.5, 112.5),
    (8, "2016-07-12", 150, "Customer_17761", 200, "Laptop", "Electronics", 9, 49.33, 443.97)
]

# SQL to insert data into the 'sales' table
insert_data_query = '''
INSERT INTO sales (order_id, order_date, customer_id, customer_name, product_id, product_names, categories, quantity, price, total)
VALUES (?, ?, ?, ?, ?, ?, ?, ?, ?, ?)
'''

# Insert the sample data
cursor.executemany(insert_data_query, sample_data)

# Commit the transaction
conn.commit()

# Close the connection
conn.close()

print(f"Database '{DATABASE_NAME}' has been created and populated successfully.")
数据看板功能概览
本数据看板将具备以下功能:
- 关键指标。 总收入、总订单数、平均订单价值、最畅销类别
- 不同图表类型。 随时间变化的收入(折线图)、按类别划分的收入(柱状图)、按收入排名的热门产品(水平柱状图)
- 筛选。 按日期和类别进行筛选
- 数据表。 以分页和可搜索的网格形式显示数据记录。
环境配置
接下来,将通过一系列步骤来配置开发环境。
1/ 安装 Node.js。
Node.js 是一个运行时环境,允许在浏览器外部运行 JavaScript,从而能够使用 JavaScript 构建快速且可扩展的服务器端应用程序。
因此,请确保系统已安装 Node.js,以便运行本地服务器和管理软件包。可以从Node.js 官方网站下载。
2/ 创建主项目文件夹和子文件夹
打开命令终端并运行以下命令。文中使用了Windows系统上的Ubuntu环境进行演示,但读者可以根据自己偏好的命令行工具和系统进行调整。
$ mkdir my-dashboard
$ cd my-dashboard
$ mkdir client
% mkdir server
3/ 初始化 Node 项目
$ npm init -y
此命令会自动在项目目录中创建一个默认的 package.json 文件,无需用户输入。
-y 标志表示对所有提示回答“是”,使用以下字段的默认值:
- name
- version
- description
- main
- scripts
- author
- license
以下是生成的 package.json 文件示例:
{
  "name": "my-dashboard",
  "version": "1.0.0",
  "main": "index.js",
  "scripts": {
    "test": "echo "Error: no test specified" && exit 1"
  },
  "keywords": [],
  "author": "",
  "license": "ISC",
  "description": "",
  "dependencies": {
    "express": "^4.21.2",
    "sqlite3": "^5.1.7"
  }
}
4/ 安装 Express 和 SQLite
SQLite 是一个轻量级、基于文件的关系型数据库引擎,它将所有数据存储在一个单一、便携的文件中,无需独立的服务器。
Express 是一个用于 Node.js 的极简、灵活的 Web 应用程序框架,通过路由和中间件简化了 API 和 Web 服务器的构建。
可以使用以下命令安装两者:
$ npm install express sqlite3
现在,可以开始开发代码了。本项目将需要四个代码文件:一个 index.html 文件、一个 server.js 文件、一个 client.js 文件和一个 script.js 文件。
接下来,将逐步介绍每个文件。
1) client/index.html
<!DOCTYPE html>
<html lang="en">
<head>
    <meta charset="UTF-8">
    <meta name="viewport" content="width=device-width, initial-scale=1.0">
    <link rel="stylesheet" href="https://stackpath.bootstrapcdn.com/bootstrap/4.3.1/css/bootstrap.min.css">
    <link rel="stylesheet" href="https://cdn.jsdelivr.net/npm/flatpickr/dist/flatpickr.min.css">
    <link rel="stylesheet" href="style.css">
    <title>Sales Performance Dashboard</title>
</head>
<body>
    <div class="container">
        <!-- Centered Heading -->
        <h1 class="text-center">Sales Performance Dashboard</h1>

        <!-- Filter Section -->
        <div class="filters row my-4">
            <div class="col-md-4">
                <label for="start-date">Start Date</label>
                <input type="text" id="start-date" class="form-control" placeholder="Start Date">
            </div>
            <div class="col-md-4">
                <label for="end-date">End Date</label>
                <input type="text" id="end-date" class="form-control" placeholder="End Date">
            </div>
            <div class="col-md-4">
                <label for="category-filter">Category</label>
                <select id="category-filter" class="form-control">
                    <option value="all">All Categories</option>
                    <!-- Options will be populated dynamically -->
                </select>
            </div>
        </div>

        <!-- Key Metrics Section -->
        <h2 class="mt-5">Key Metrics</h2> <!-- Added heading for Key Metrics -->
        <div id="key-metrics" class="row text-center my-4">
            <div class="col-md-3">
                <h4>Total Revenue</h4>
                <p id="total-revenue">$0</p>
            </div>
            <div class="col-md-3">
                <h4>Total Orders</h4>
                <p id="total-orders">0</p>
            </div>
            <div class="col-md-3">
                <h4>Average Order Value</h4>
                <p id="average-order-value">$0</p>
            </div>
            <div class="col-md-3">
                <h4>Top Category</h4>
                <p id="top-category">None</p>
            </div>
        </div>

        <!-- Chart Section -->
        <div class="chart-section my-4">
            <label for="chart-type-selector">Select Chart:</label>
            <select id="chart-type-selector" class="form-control mb-3">
                <option value="revenueOverTime">Revenue Over Time</option>
                <option value="revenueByCategory">Revenue By Category</option>
                <option value="topProducts">Top Products by Revenue</option>
            </select>
            <canvas id="chart-canvas"></canvas>
        </div>

        <!-- Raw Data Table Section -->
        <div id="raw-data" class="my-4">
            <h3>Raw Data</h3>
            <table id="data-table" class="table table-striped table-bordered"></table>
        </div>
    </div>

    <!-- Required JS Libraries -->
    <script src="https://code.jquery.com/jquery-3.5.1.min.js"></script>
    <script src="https://cdn.datatables.net/1.10.21/js/jquery.dataTables.min.js"></script>
    <script src="https://cdn.jsdelivr.net/npm/chart.js"></script>
    <script src="https://cdn.jsdelivr.net/npm/flatpickr"></script>
    <script src="script.js"></script>
</body>
</html>
此 HTML 文件构建了销售业绩看板的基本视觉元素,包括用于日期和类别的交互式筛选器、显示关键销售指标的区域、用于选择图表类型的下拉菜单以及原始数据表。
它使用了 Bootstrap 进行样式设计,Flatpickr 处理日期输入,Chart.js 用于数据可视化,而 DataTables 则负责表格数据的展示。所有的交互逻辑由外部的 script.js 文件处理,该文件将在稍后进行详细介绍。
Bootstrap 是一个流行的前端框架,最初由 Twitter 开发,可帮助开发者更轻松、快速地构建响应式且视觉一致的网页界面。
DataTables 是一个基于 jQuery 的插件,它增强了标准的 HTML <table> 元素,将其转换为功能丰富、完全交互式的表格。
Flatpickr 是一个轻量级、可定制的 JavaScript 日期和时间选择器。它允许用户从简洁的弹出日历中选择日期(以及可选的时间),而无需手动输入。
Chart.js 是一个简单而强大的 JavaScript 库,用于在 Web 应用程序中利用 <canvas> 元素创建交互式、动画化的图表。
2) client/style.css
/* client/style.css */
body {
    background-color: #f8f9fa;
    font-family: 'Arial', sans-serif;
}

h1 {
    text-align: center; /* Center the heading */
    margin-top: 20px; /* Add spacing above the heading */
    margin-bottom: 40px; /* Add spacing below the heading */
}

.container .filters {
    margin-top: 20px;
    margin-bottom: 60px !important; /* Ensure larger spacing between filters and Key Metrics */
}

.container #key-metrics {
    margin-top: 40px !important; /* Additional spacing above the Key Metrics section */
    margin-bottom: 20px; /* Optional spacing below */
}

.key-metrics div {
    margin: 10px 0;
    padding: 10px;
    background-color: #f4f4f4;
    border: 1px solid #ccc;
    border-radius: 4px;
}

/* Fix for DataTables Pagination Spacing */
.dataTables_wrapper .dataTables_paginate {
    text-align: center;
    margin-top: 10px;
}

.dataTables_wrapper .dataTables_paginate .paginate_button {
    margin: 0 12px;
    padding: 5px 10px;
    border: 1px solid #ddd;
    border-radius: 4px;
    background-color: #f9f9f9;
    color: #007bff;
    text-decoration: none;
    display: inline-block;
}

.dataTables_wrapper .dataTables_paginate .paginate_button:hover {
    background-color: #007bff;
    color: #fff;
    border: 1px solid #007bff;
}

.dataTables_wrapper .dataTables_paginate .paginate_button.current {
    font-weight: bold;
    color: #fff;
    background-color: #007bff;
    border-color: #007bff;
}
本项目的级联样式表 (CSS) 文件用于定义看板的基本视觉组件样式,例如按钮和文本颜色、元素间距等。
style.css 文件赋予了看板整体的外观和风格,呈现出简洁、明亮的主题,并进行了充足的间距和布局调整,以确保清晰度和可读性。此外,style.css 文件还自定义了 DataTables 分页按钮的外观,使其更具用户友好性,并与 Bootstrap 的设计风格保持一致。
3) server/server.js
const express = require('express');
const sqlite3 = require('sqlite3').verbose();
const path = require('path');
const app = express();
const PORT = 3000;

// Full path to your SQLite database
const DB_PATH = "C:Users	homaprojectsmy-dashboardsales_data.db";

// Serve static files from the client directory
app.use(express.static(path.join(__dirname, '..', 'client')));

// Route to fetch data from SQLite database
app.get('/data', (req, res) => {
    const db = new sqlite3.Database(DB_PATH, sqlite3.OPEN_READONLY, (err) => {
        if (err) {
            console.error("Error connecting to database:", err.message);
            res.status(500).json({ error: "Database connection failed" });
            return;
        }
    });

    // Query the database
    const query = "SELECT * FROM sales;"; // Replace 'sales' with your table name
    db.all(query, [], (err, rows) => {
        if (err) {
            console.error("Error running query:", err.message);
            res.status(500).json({ error: "Query failed" });
        } else {
            res.json(rows); // Send the query result as JSON
        }
    });

    db.close((err) => {
        if (err) {
            console.error("Error closing database:", err.message);
        }
    });
});

// Catch-all route to serve the main HTML file
app.get('*', (req, res) => {
    res.sendFile(path.join(__dirname, '..', 'client', 'index.html'));
});

// Start the server
app.listen(PORT, () => {
    console.log(`Server running at http://localhost:${PORT}`);
});
这个 Node.js 脚本包含了设置支持销售业绩看板的基本 Express 服务器的 JavaScript 代码。它主要执行两项任务:
- 从客户端(client)子文件夹提供静态文件(如 HTML、CSS 和 JS),以便前端在浏览器中加载。
- 提供一个 /data API 接口,该接口从本地 SQLite 数据库 (sales_data.db) 读取数据,并以 JSON 格式返回整个销售表,从而在前端实现动态数据可视化和表格展示。
4) client/script.js
let chartInstance = null; // Global variable to store the current Chart.js instance

// Wait until the DOM is fully loaded
document.addEventListener('DOMContentLoaded', function () {
    // Fetch sales data from the backend API
    fetch('/data')
        .then((response) => response.json())
        .then((data) => {
            // Handle case where no data is returned
            if (!data || data.length === 0) {
                const app = document.getElementById('app');
                if (app) {
                    app.innerHTML = "<p>No data available.</p>";
                }
                return;
            }

            // Initialize filters and dashboard content
            setupFilters(data);
            initializeDashboard(data);

            // Re-render charts when chart type changes
            document.getElementById('chart-type-selector').onchange = () => filterAndRenderData(data);
        })
        .catch((error) => {
            // Handle fetch error
            console.error('Error fetching data:', error);
            const app = document.getElementById('app');
            if (app) {
                app.innerHTML = "<p>Failed to fetch data.</p>";
            }
        });
});

// Initialize Flatpickr date pickers and category filter
function setupFilters(data) {
    // Convert date strings to JS Date objects
    const dates = data.map((item) => new Date(item.order_date.split('/').reverse().join('-')));
    const minDate = new Date(Math.min(...dates));
    const maxDate = new Date(Math.max(...dates));

    // Configure start date picker
    flatpickr("#start-date", {
        defaultDate: minDate.toISOString().slice(0, 10),
        dateFormat: "Y-m-d",
        altInput: true,
        altFormat: "F j, Y",
        onChange: function () {
            filterAndRenderData(data);
        },
    });

    // Configure end date picker
    flatpickr("#end-date", {
        defaultDate: maxDate.toISOString().slice(0, 10),
        dateFormat: "Y-m-d",
        altInput: true,
        altFormat: "F j, Y",
        onChange: function () {
            filterAndRenderData(data);
        },
    });

    // Set up category dropdown change listener
    const categoryFilter = document.getElementById('category-filter');
    if (categoryFilter) {
        categoryFilter.onchange = () => filterAndRenderData(data);
    }
}

// Initialize dashboard after filters are set
function initializeDashboard(data) {
    populateCategoryFilter(data);     // Populate category dropdown
    filterAndRenderData(data);       // Initial render with all data
}

// Apply filters and update key metrics, chart, and table
function filterAndRenderData(data) {
    const chartType = document.getElementById('chart-type-selector').value;
    const startDate = document.getElementById('start-date')._flatpickr.selectedDates[0];
    const endDate = document.getElementById('end-date')._flatpickr.selectedDates[0];
    const selectedCategory = document.getElementById('category-filter').value;

    // Filter data by date and category
    const filteredData = data.filter((item) => {
        const itemDate = new Date(item.order_date.split('/').reverse().join('-'));
        return (
            itemDate >= startDate &&
            itemDate <= endDate &&
            (selectedCategory === 'all' || item.categories === selectedCategory)
        );
    });

    updateKeyMetrics(filteredData);                   // Update metrics like revenue and orders
    drawChart(filteredData, 'chart-canvas', chartType); // Render chart
    populateDataTable(filteredData);                  // Update table
}

// Update dashboard metrics (total revenue, order count, etc.)
function updateKeyMetrics(data) {
    const totalRevenue = data.reduce((acc, item) => acc + parseFloat(item.total), 0);
    const totalOrders = data.length;
    const averageOrderValue = totalOrders > 0 ? totalRevenue / totalOrders : 0;

    // Calculate total revenue per category to find top category
    const revenueByCategory = data.reduce((acc, item) => {
        const category = item.categories || "Uncategorized";
        acc[category] = (acc[category] || 0) + parseFloat(item.total);
        return acc;
    }, {});

    // Determine category with highest total revenue
    const topCategory = Object.keys(revenueByCategory).reduce(
        (a, b) => (revenueByCategory[a] > revenueByCategory[b] ? a : b),
        "None"
    );

    // Display metrics in the DOM
    document.getElementById('total-revenue').textContent = `$${totalRevenue.toFixed(2)}`;
    document.getElementById('total-orders').textContent = `${totalOrders}`;
    document.getElementById('average-order-value').textContent = `$${averageOrderValue.toFixed(2)}`;
    document.getElementById('top-category').textContent = topCategory || 'None';
}

// Draw the selected chart type using Chart.js
function drawChart(data, elementId, chartType) {
    const ctx = document.getElementById(elementId).getContext('2d');

    // Destroy previous chart if one exists
    if (chartInstance) {
        chartInstance.destroy();
    }

    switch (chartType) {
        case 'revenueOverTime':
            // Line chart showing revenue by order date
            chartInstance = new Chart(ctx, {
                type: 'line',
                data: {
                    labels: data.map((item) => item.order_date),
                    datasets: [{
                        label: 'Revenue Over Time',
                        data: data.map((item) => parseFloat(item.total)),
                        fill: false,
                        borderColor: 'rgb(75, 192, 192)',
                        tension: 0.1,
                    }],
                },
                options: {
                    scales: {
                        y: { beginAtZero: true },
                    },
                },
            });
            break;

        case 'revenueByCategory':
            // Bar chart showing total revenue per category
            const categories = [...new Set(data.map((item) => item.categories))];
            const revenueByCategory = categories.map((category) => {
                return {
                    category,
                    revenue: data
                        .filter((item) => item.categories === category)
                        .reduce((acc, item) => acc + parseFloat(item.total), 0),
                };
            });
            chartInstance = new Chart(ctx, {
                type: 'bar',
                data: {
                    labels: revenueByCategory.map((item) => item.category),
                    datasets: [{
                        label: 'Revenue by Category',
                        data: revenueByCategory.map((item) => item.revenue),
                        backgroundColor: 'rgba(255, 99, 132, 0.2)',
                        borderColor: 'rgba(255, 99, 132, 1)',
                        borderWidth: 1,
                    }],
                },
                options: {
                    scales: {
                        y: { beginAtZero: true },
                    },
                },
            });
            break;

        case 'topProducts':
            // Horizontal bar chart showing top 10 products by revenue
            const productRevenue = data.reduce((acc, item) => {
                const productName = item.product_names || 'Unknown Product';
                acc[productName] = (acc[productName] || 0) + parseFloat(item.total);
                return acc;
            }, {});

            const topProducts = Object.entries(productRevenue)
                .sort((a, b) => b[1] - a[1])
                .slice(0, 10);

            chartInstance = new Chart(ctx, {
                type: 'bar',
                data: {
                    labels: topProducts.map((item) => item[0]), // Product names
                    datasets: [{
                        label: 'Top Products by Revenue',
                        data: topProducts.map((item) => item[1]), // Revenue
                        backgroundColor: 'rgba(54, 162, 235, 0.8)',
                        borderColor: 'rgba(54, 162, 235, 1)',
                        borderWidth: 1,
                    }],
                },
                options: {
                    indexAxis: 'y', // Horizontal bars
                    scales: {
                        x: { beginAtZero: true },
                    },
                },
            });
            break;
    }
}

// Display filtered data in a DataTable
function populateDataTable(data) {
    const tableElement = $('#data-table');

    // Destroy existing table if it exists
    if ($.fn.DataTable.isDataTable(tableElement)) {
        tableElement.DataTable().clear().destroy();
    }

    // Create a new DataTable with relevant columns
    tableElement.DataTable({
        data: data.map((item) => [
            item.order_id,
            item.order_date,
            item.customer_id,
            item.product_names,
            item.categories,
            `$${parseFloat(item.total).toFixed(2)}`,
        ]),
        columns: [
            { title: "Order ID" },
            { title: "Order Date" },
            { title: "Customer ID" },
            { title: "Product" },
            { title: "Category" },
            { title: "Total" },
        ],
    });
}

// Populate the category filter dropdown with available categories
function populateCategoryFilter(data) {
    const categoryFilter = document.getElementById('category-filter');
    categoryFilter.innerHTML = '';
    categoryFilter.appendChild(new Option('All Categories', 'all', true, true));

    // Extract unique categories
    const categories = new Set(data.map((item) => item.categories));
    categories.forEach((category) => {
        categoryFilter.appendChild(new Option(category, category));
    });
}
这是本项目中最复杂的代码文件,但它承担了大量关键任务。该 JavaScript 文件驱动着销售业绩看板的交互性和数据可视化功能。简而言之,它负责:
1/ 获取销售数据
- 页面加载时(
DOMContentLoaded事件),它会调用后端 API 的/data接口。 - 如果未返回数据,则显示“无可用数据”的消息。
2/ 设置筛选器
- 使用 Flatpickr 日期选择器,根据数据集的最小/最大订单日期选择开始和结束日期。
- 添加一个类别下拉菜单,允许用户按产品类别进行筛选。
- 添加一个图表类型选择器,用于在不同的图表可视化之间切换。
3/ 初始化看板
- 用可用的类别填充类别筛选器。
- 使用完整数据集进行首次渲染。
4/ 应用筛选并重新渲染
- 每次用户更改筛选条件(日期范围、类别或图表类型)时,它会:
- 根据日期范围和类别筛选数据集。
- 更新关键指标:总收入、订单数量、平均订单价值和最高收入类别。
- 重新绘制所选的 Chart.js 图表。
- 刷新数据表。
5/ 使用 Chart.js 绘制图表
- 按时间线划分的收入 (Revenue Over Time) → 折线图,显示按日期划分的收入趋势。
- 按类别划分的收入 (Revenue by Category) → 柱状图,汇总每个类别的总收入。
- 热门产品 (Top Products) → 水平柱状图,显示按收入排名的前 10 种产品。
6/ 显示表格数据
- 使用 DataTables (一个 jQuery 插件) 渲染过滤后的订单表格,包含订单ID、日期、客户ID、产品、类别和总金额等列。
7/ 保持用户界面同步
- 当筛选条件改变时,销毁并重新创建图表/表格,以避免重复。
- 保持指标、图表和表格与当前激活的筛选条件一致。
运行数据看板
现在,所有代码已准备就绪,是时候运行数据看板了。请进入 server 子文件夹并输入以下命令:
$ node server.js
执行上述命令后,将会收到类似如下的响应:
Server running at http://localhost:3000
在 Web 浏览器中打开 http://localhost:3000。应该能看到数据看板已通过 SQLite 数据库中的数据填充,如下图所示。
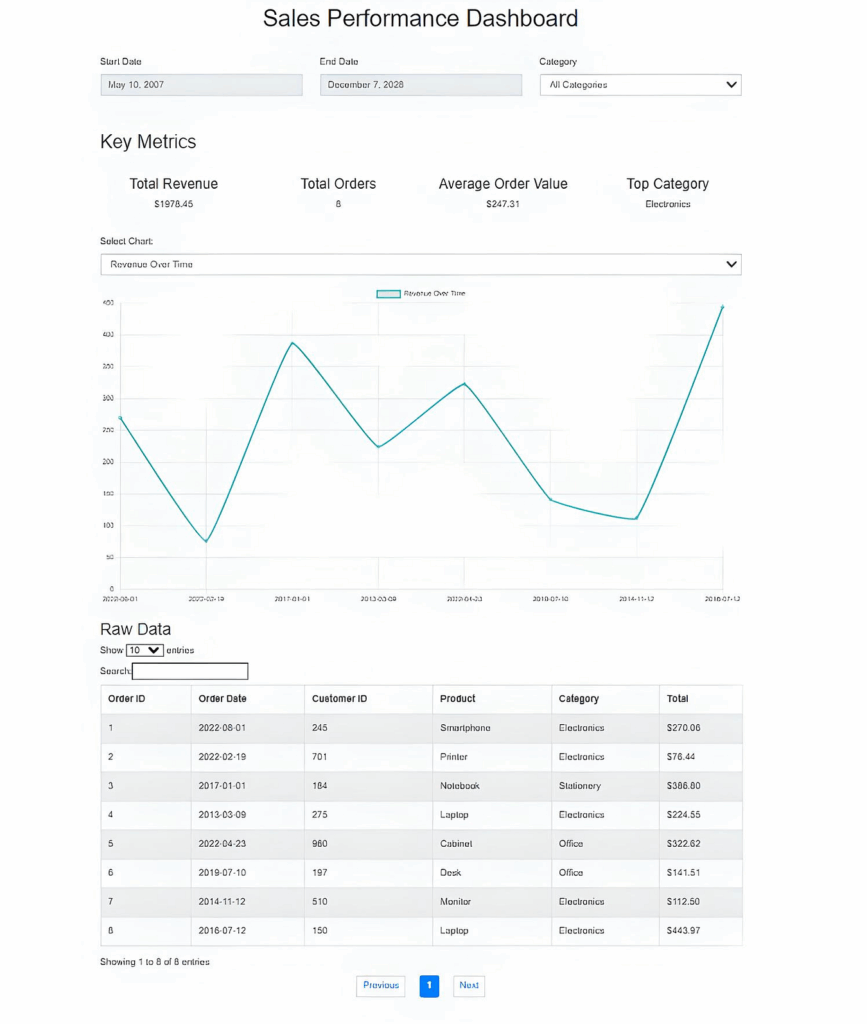
所有筛选器、图表选择等功能都应如预期般正常运行。
总结
本文详细介绍了如何使用核心 Web 技术——HTML、CSS、JavaScript、Node.js、Express 和本地 SQLite 数据库——来构建一个功能齐全、交互式的销售业绩看板。
文中探讨了技术栈和环境设置,具体包括:
- 后端:Node.js、Express、SQLite
- 前端:HTML、Bootstrap(用于布局)、Chart.js(用于图表)、Flatpickr(日期选择器)、DataTables(用于表格数据)
- 项目文件夹结构如下所示:
my-dashboard/
├── client/
│   ├── index.html
│   ├── style.css
│   └── script.js
└── server/
    └── server.js
文章展示了如何通过代码创建和填充一个 SQLite 数据库,作为数据看板的数据源。同时,也讨论了环境设置以及前端和后端开发过程,并简要介绍了数据看板的功能。
最后,详细解释了所需的四个代码文件,并演示了如何在浏览器中运行此数据看板。

![图1. ResNet的构建块,通常称为“瓶颈块”[4]。](https://accesspath-com-1252517293.cos.ap-nanjing.myqcloud.com/2025/10/20251004055115539.png)